CSR Data & Evaluations
CSR Overview
Scope of Review Operations at CSR


100%
CSR reviews 100% of NIH research proposals, cooperative agreements, and R&D contracts.


>250
In over 250 chartered or recurring study sections.


<0.5%
CSR does this with less than 0.5% of the total NIH budget.


~25,000
CSR engages approximately 25,000 distinct reviewers.


~1,300
CSR conducts approximately 1,300 review meetings each year.


>450
CSR employs more than 450 scientific review officers.
CY2025 Data
CSR Also Participates in the Review of These Initiatives and Inter-agency Collaborations
National Institutes of Health
NIH All-of-Us Program Reviews, plus Other Transaction Authority Reviews
National Institutes of Health
Brain Research through Advancing Innovative Neurotechnologies (BRAIN)
National Institutes of Health
NIGMS Maximizing Investigators’ Research Awards (MIRA)
National Institutes of Health
Native American Research Centers for Health (NARCH)
Global Alliance for Chronic Disease
National Institutes of Health
All Division of Program Coordination, Planning, and Strategic Initiatives (DPCPSI)/Common Fund review
Food & Drug Administration
FDA/Tobacco
National Institutes of Health
Cancer Moonshot
National Institutes of Health
Alzheimer's Disease (AD)
National Institutes of Health
All Office of the Director (OD)/Office of Research Infrastructure Programs (ORIP) Reviews
National Institutes of Health
National Science Foundation
U.S. Department of Energy
NIH-NSF and NIH-DOE
Return to top
Completed Evaluations
CSR Anonymization Study
CSR worked with an outside contractor to examine various potential sources of bias.
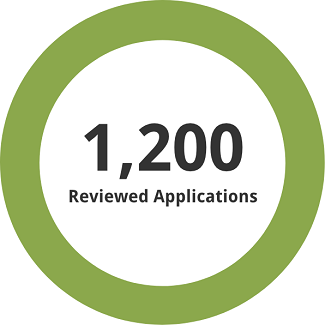
1,200 previously reviewed applications, both full and redacted, were used for the assessment.
The experimental approach, results, and data analysis were published in the peer-reviewed journal eLife: eLife 2021;10:e71368.
We found:
- Redaction does not affect the scores for grants submitted by African-American investigators.
- Redaction slightly worsens the scores for grants submitted by White investigators. The effect size is small but statistically significant.
- Redaction was not very effective at preventing identification of the investigator; > 20% of reviewers correctly identified the investigator.
CSR Application Review Evaluations
Commensuration Bias Study
Do reviewers use criteria scores to derive overall impact scores differently for Black versus White applicants?
Outcome: Small but statistically significant commensuration bias, but these effects are very small and do not account for the much larger disparities in overall impact scores between applications from White and Black applicants. Science Advances 03 June 2020
Intra-IRG Ranking Study
Will reviewer rankings of the top 20% of applications across study sections within an integrated review group (IRG) (CSR management cluster) reveal differences in the quality of science among the study sections?
Outcome: No large differences in quality evident among study sections. Rankings were also related to the reviewers’ familiarity with the science of each application and adjusting for reviewer familiarity further reduced the size of the differences in rankings between scientific review groups (SRGs).
Half Point Pilot
Will allowing reviewers to use 0.5 increments
for scoring (e.g. 1.5, 2.0, 2.5) improve score compression?
Outcome: Half-point option did not significantly improve score compression for most study sections or significantly alter rank order of applications under evaluation. CSR will not implement.
Return to top
Ongoing Evaluations
How Does Meeting Format Affect Review?
Although CSR had prior experience with a range of formats for review meetings, the COVID-19 pandemic forced a move to entirely remote review meetings. To assess the impact of the change in meeting format on peer review, CSR conducted two surveys, one in 2020 and another in 2021, each involving approximately 8,000 reviewers, to evaluate the experience of the reviewers, determine if they have a particular preference for meeting format, and assess any potential impact on review outcomes and reviewer recruitment. We also issued a blog on the subject and collected and analyzed comments.
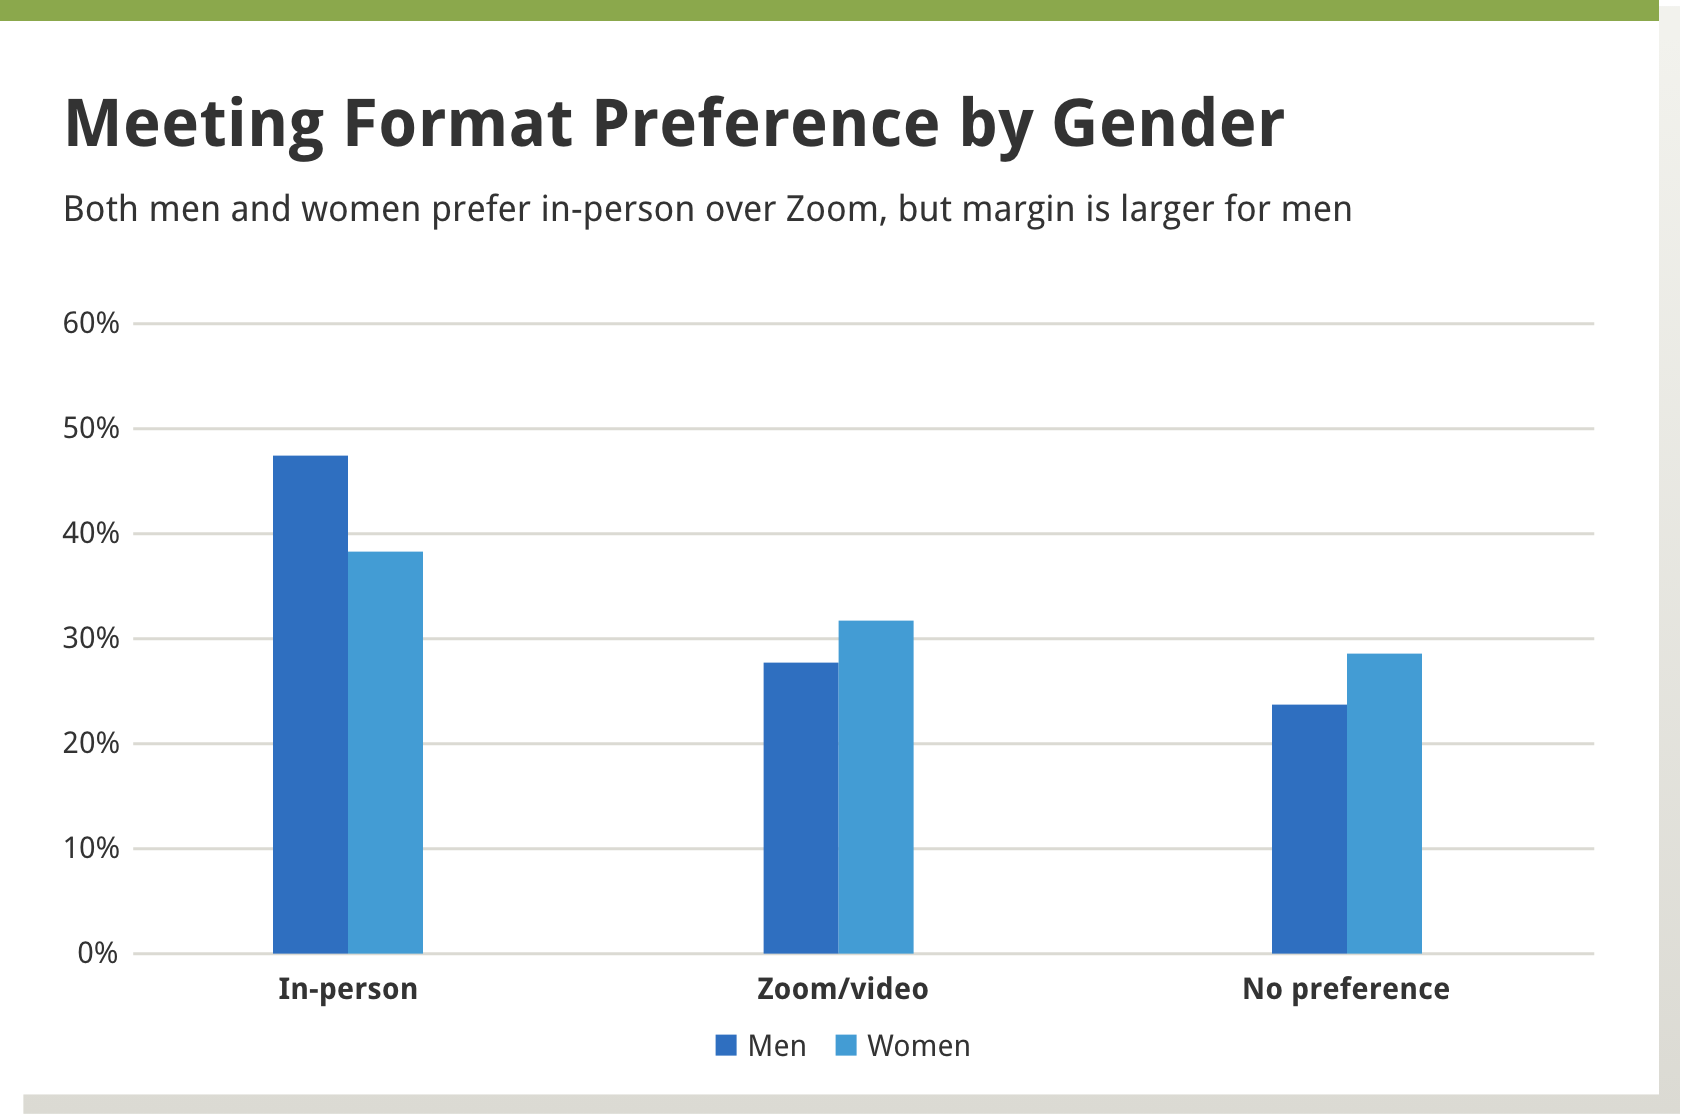
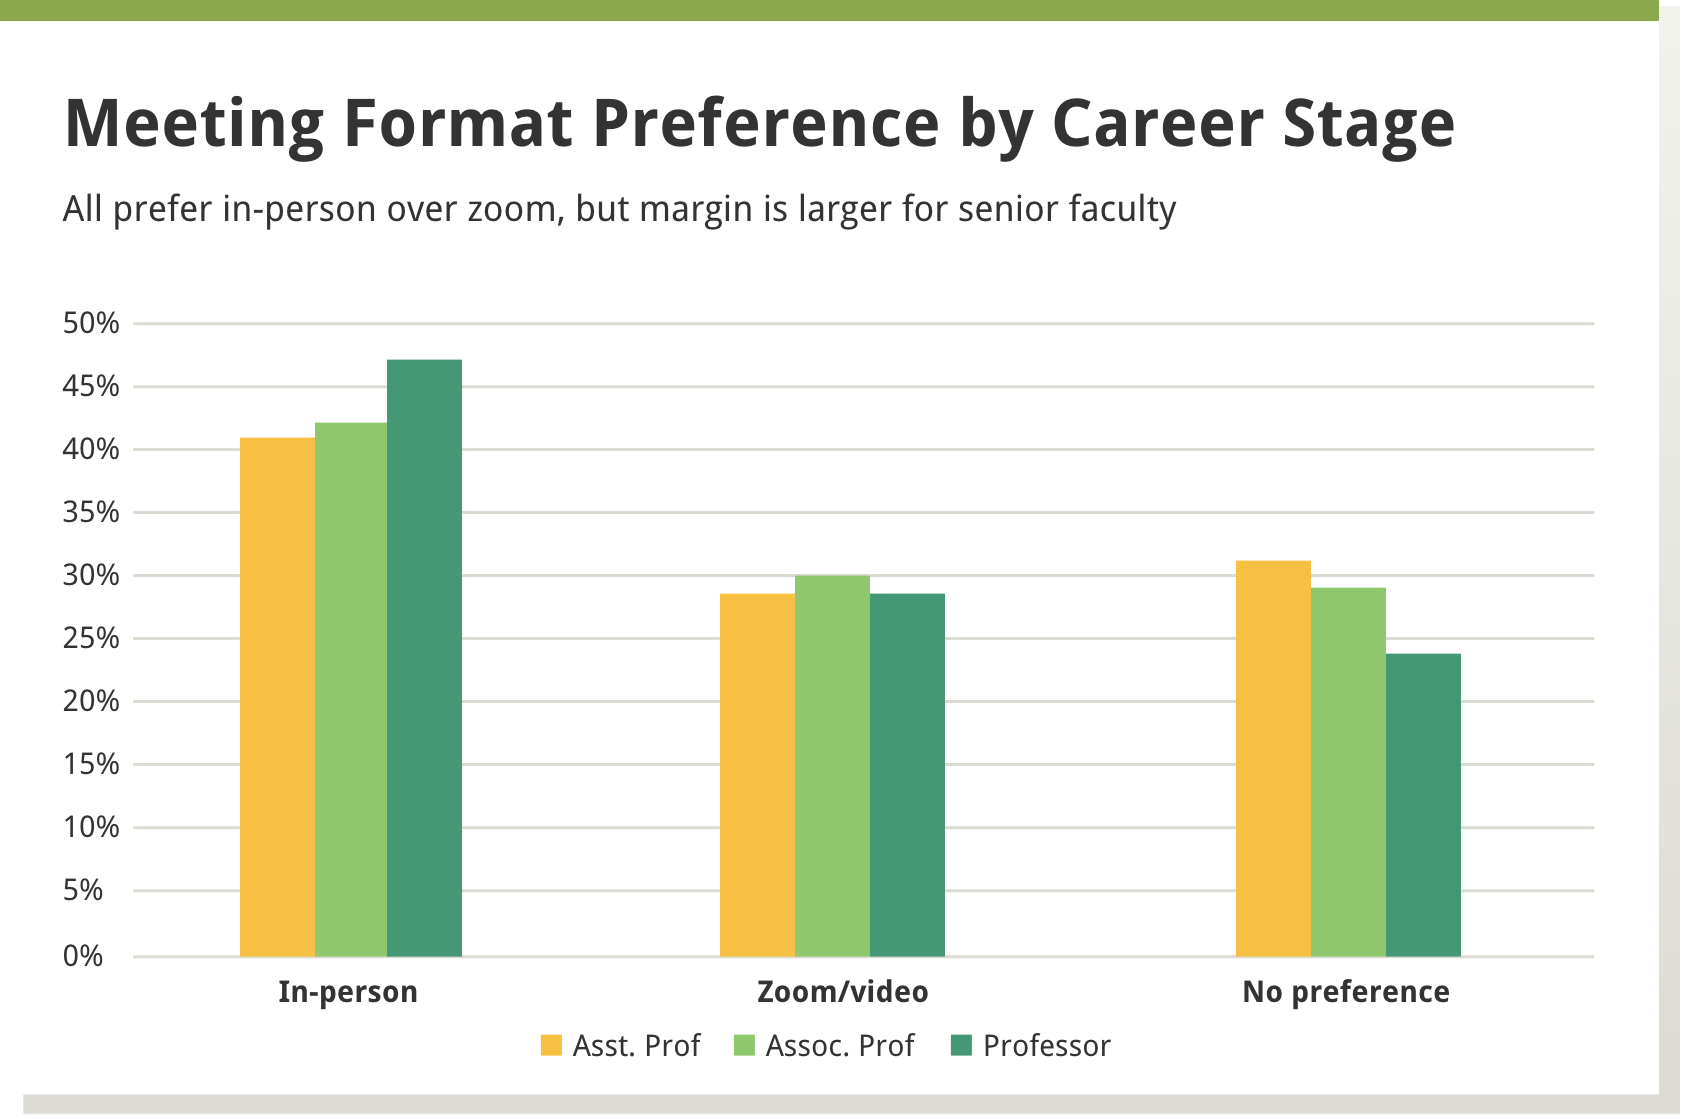
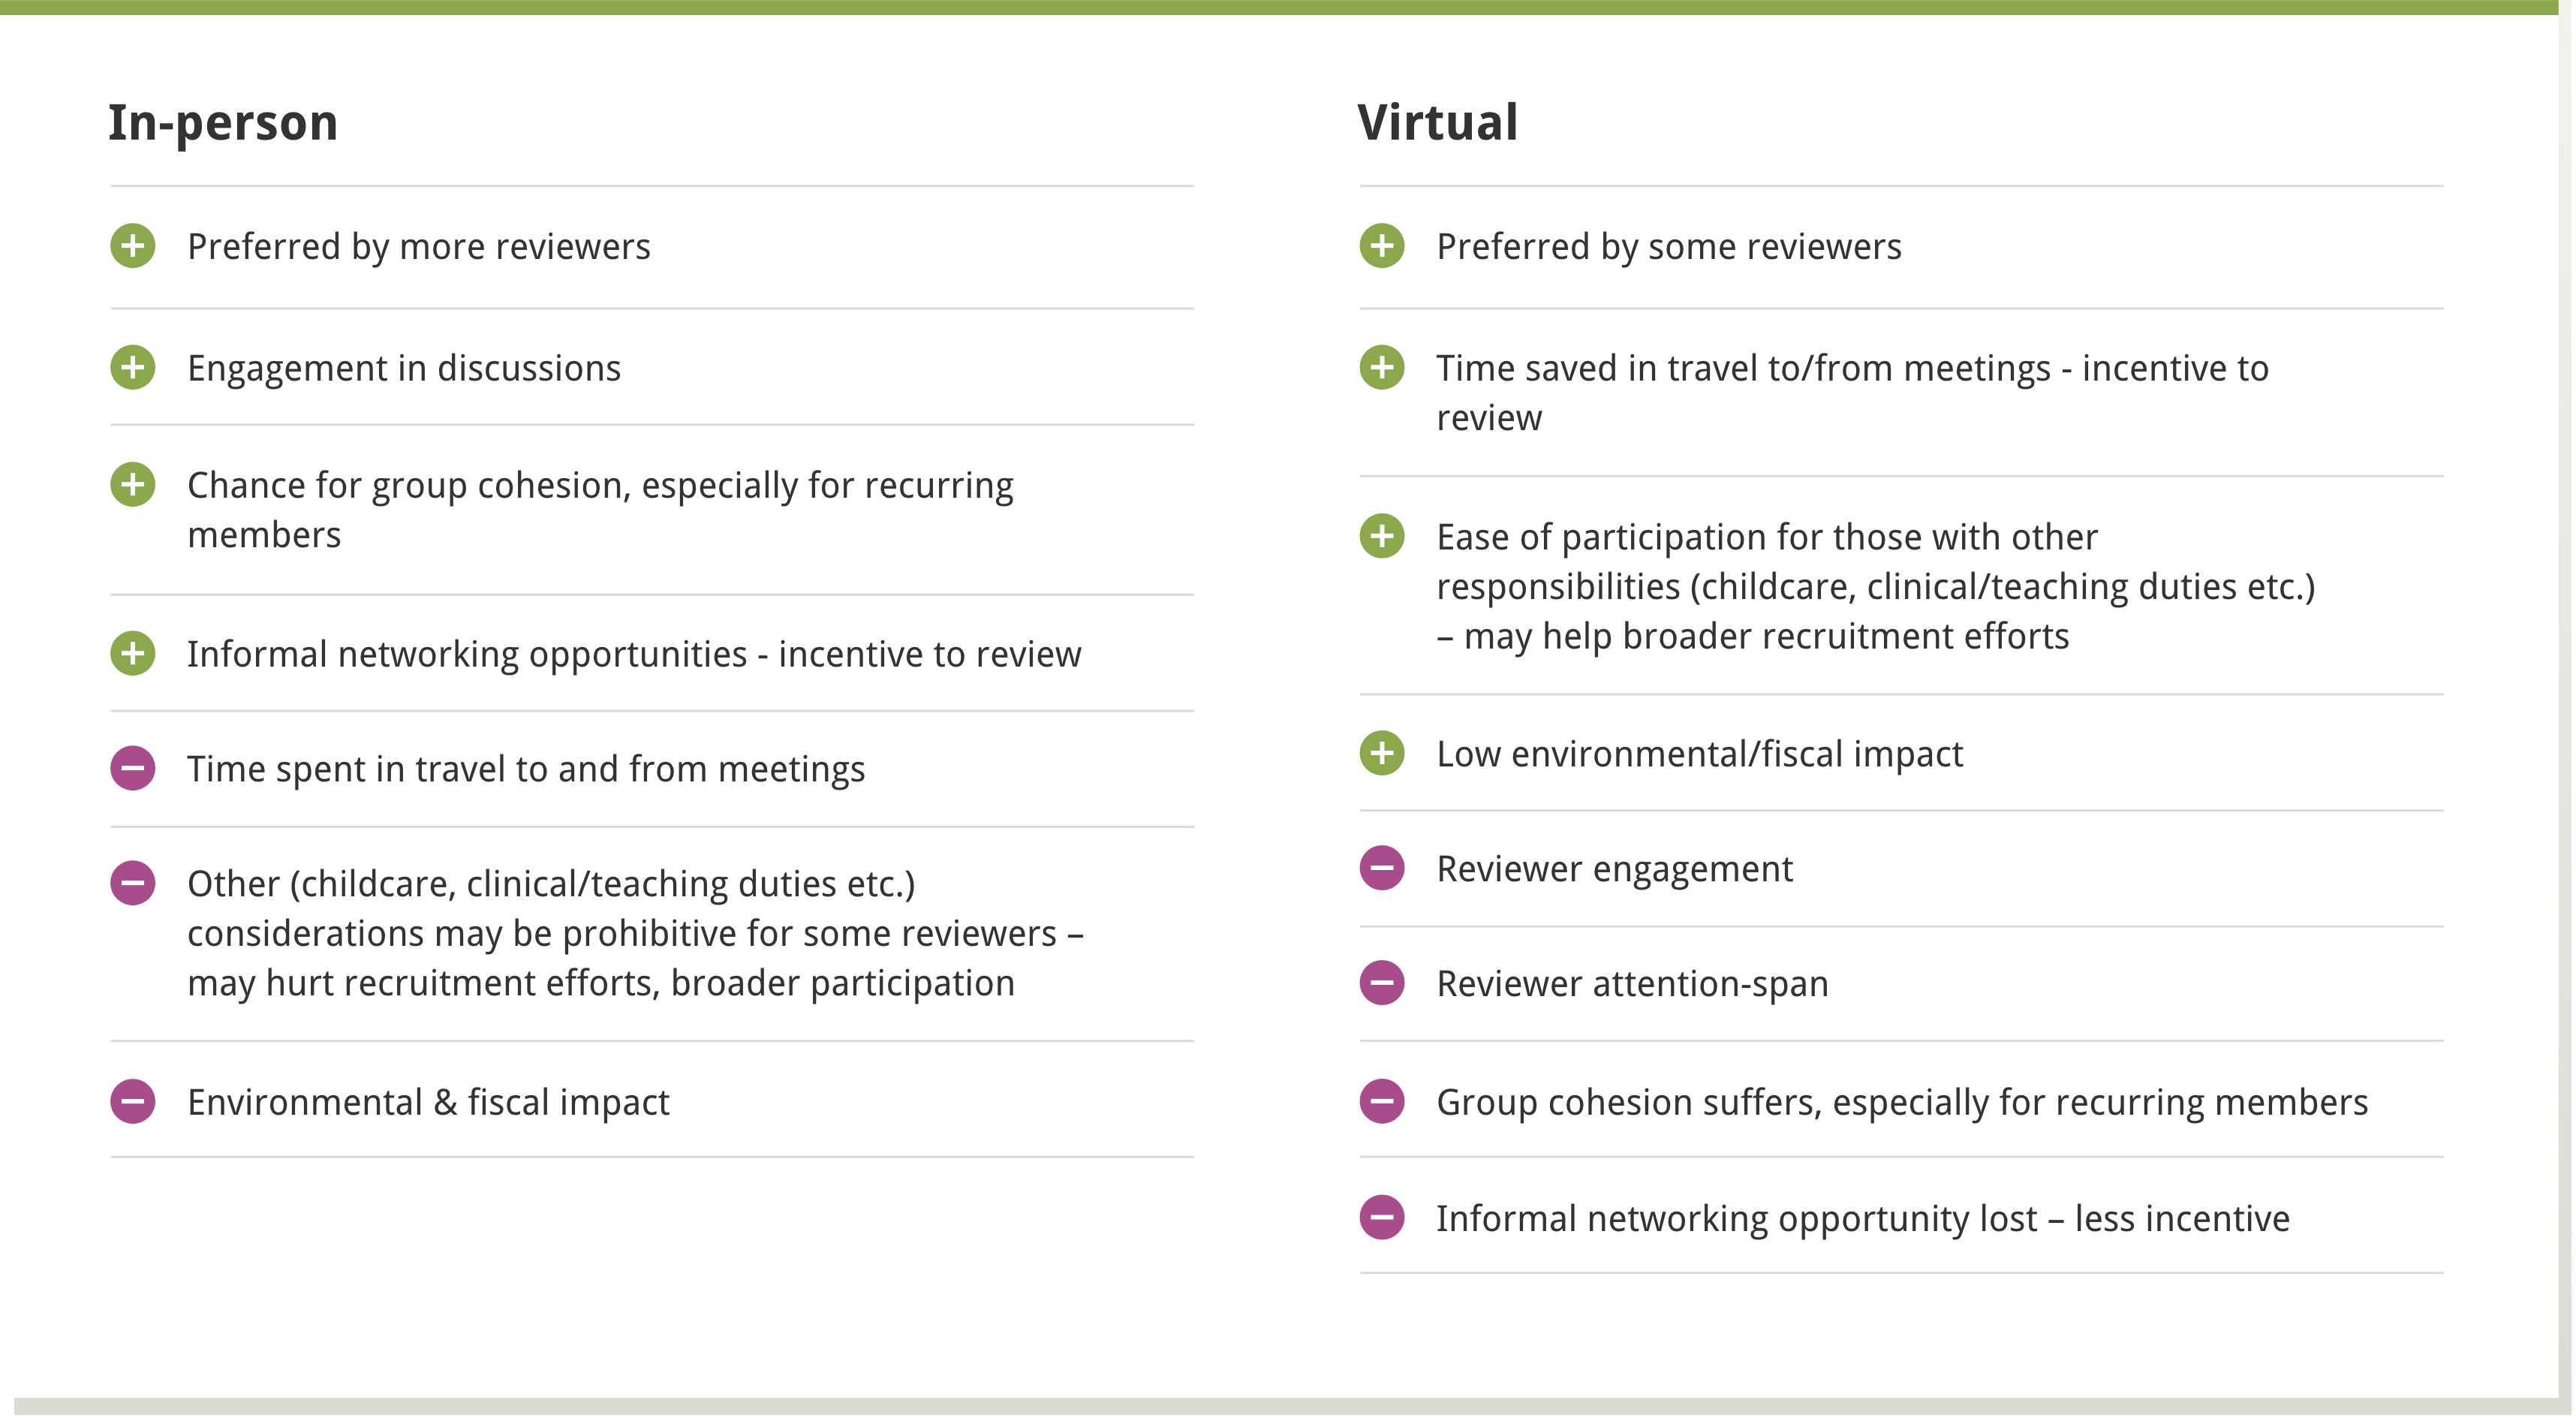
We found that in-person meetings were preferred by about 40% of the reviewers, a little less than a third preferred virtual meetings, and about a third had no preference. A larger percentage of men, versus women, preferred in-person meetings, as well as those more established in their careers versus those in earlier career stages—see Boxes 1 and 2 below.
Reviewers rated the quality of in-person and virtual meetings similarly, and we found no significant change in score distributions between in-person and virtual meetings.
However, engagement appeared to suffer in virtual meetings. Nearly half of all reviewers (46%) reported having a shorter attention span during a virtual meeting and quantitative analyses also suggest that virtual meetings tend to be longer. See Box 3 below for additional advantages and disadvantages of in-person versus virtual meetings.
In Fall 2022, CSR began again to hold some in-person meetings. For standing panels and recurring special emphasis panels, we held one of three meetings per year in-person.
Additionally, from summer 2023 through winter 2024, we held several meetings each round in a hybrid format, where some reviewers attended in person and others virtually. The remainder of peer review meetings were held virtually. Since spring of 2025, all meetings have been held virtually. Multiple analyses of the effect of meeting format on meeting experience, characteristics of ad hoc reviewers recruited, and scoring behavior have been completed:
- Comparison of face-to-face, virtual, and hybrid meetings – Summer 2024 review meetings
- Initial analysis of hybrid meeting format – Summer 2023-Winter 2024 review meetings
- Comparison of face-to-face and virtual meetings - Summer 2023 review meetings
- Comparison of face-to-face and virtual meetings – Fall 2022
Both Formats (in-person, virtual) have pluses and minuses
Return to top
Early Career Reviewer (ECR) Program
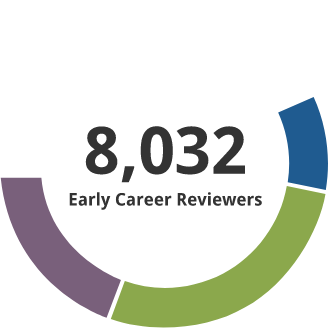
The Early Career Reviewer (ECR) Program was established in late 2011. The program enriches the pool of NIH reviewers and gives scientists peer review experience that they can apply in crafting competitive applications.
- 10,109 individuals have received ECR training and have served on study sections.
- 1306 former ECRs have served as members of standing study sections or are currently members. The program began in late 2011. It focuses on new faculty, and time to tenure is typically 7 years. Thus this small percentage being appointed members of panels indicates progress and we expect this to grow with time.
Data as of 7/25/2025
Analysis to be performed by CSR:
- Analysis of success rates for R01s submitted by ECRs compared to early career researchers, matched for relevant career characteristics
- Geographic distribution and institution type for both the ECRs in our database and the ECRs recruited to review
- Survey ECRs to identify areas of program improvement
How Does Use of a Virtual Platform Affect Review Meetings?
Although CSR had prior experience with a range of formats for review meetings, the COVID-19 pandemic forced a move to entirely virtual review meetings. This move gave us the opportunity to collect a large amount of data to assess the effect of the virtual review format on the review process.
CSR held > 600 review meetings using a virtual platform from March to August 2020. In the summer of 2020, we surveyed:
- 3,288 reviewers
- 128 scientific review officers
- 73 staff supporting review meetings
We performed quantitative analyses of meeting duration and roster composition (n = 143 meetings, matched to their in-person equivalent).


- In-person meeting
- In-person meeting + video conference
- Video assisted meeting
- Virtual meeting
- Telephone assisted meeting
Reviewers and SROs prefer in-person meetings but the majority found overall quality of review in virtual meetings to be the same as or better than that in in-person meetings. Nearly half of all reviewers (46%) reported having a shorter attention span during a virtual meeting versus in an in-person meeting and quantitative analyses also suggest that virtual meetings tend to be longer.
Reviewer engagement will be a focal point as we continue to examine the use of virtual platforms for review meetings.
There was no substantial change in female or minority representation on rosters for meetings held by virtual format versus those held in person in previous review cycles. Career stage and proportion of new reviewers were also unaffected by the move to review by virtually.
CSR is continuing evaluations of virtual review meetings.
Return to top

Evaluating Panel Quality in Review (ENQUIRE)
CSR ENQUIRE
Science changes rapidly. Making sure that study sections change with the science is an ongoing challenge. CSR ENQUIRE integrates data and input from multiple stakeholders to determine whether changes in study section focus or scope are needed to facilitate the identification of high impact science, with special consideration of emerging science.
- Clusters of study sections are formed based on scientific topics (instead of CSR managerial units) for review via ENQUIRE
- Systematic, data-driven, continuous process – ~20% of CSR study sections are evaluated each year, every study section evaluated every 5 years
- Stakeholder input and involvement – external scientific community, extramural programs at NIH, CSR staff
- Iterative approach - continuous refinement of the process based on experience
- Critical to success – matching referral of applications and reviewer expertise to redefined scientific scope of study sections
Multiple Possible Actions Follow
- Change in scientific guidelines
- Merge study sections
- Create new study sections
- Redistribute areas across study sections
- Add emerging areas of science
- Eliminate study sections
Process Overview for Each Cluster of Study Sections
- Cluster Formation
- External Scientific Evaluation Panel
- Internal Process Evaluation Panel
- Approvals
- Implementation by CSR
Clusters Evaluated via ENQUIRE
Initiated in 2019, restructured and new study sections in place in October 2020:
- Healthcare Delivery and Patient Outcomes
9 study sections evaluated, resulting in 11 new or modified study sections
View the report - Gastrointestinal, Renal, Endocrine Systems
11 study sections evaluated, resulting in 10 new or modified study sections
View the report - Cardiac, Vascular and Hematologic Sciences
10 study sections evaluated, resulting in 8 new or modified study sections
View the report - Functional/Cognitive Neuroscience
12 study sections evaluated, resulting in 11 new or modified study sections
View the report
Initiated in 2020, restructured and new study sections in place in May 2022:
- Molecular and Cellular Basic Sciences
16 study sections evaluated, resulting in 12 new or modified study sections
View the report
Initiated in 2021, restructured and new study sections in place in January 2023:
- Epidemiology and Population Sciences
9 study sections evaluated, resulting in 13 new or modified study sections
View the report - Oncology
10 study sections evaluated, resulting in 13 new or modified study sections
View the report
Return to top
Integrity of the Peer Review Process

Critically Important for All of Us
We must maintain the public trust in the NIH’s stewardship of taxpayer dollars to support U.S. biomedical science research.
Confidentiality is critical for candor in discussion and evaluation, and thus impacts the very basis of the peer review process.
Ensuring integrity requires the support of the entire research community – investigators, reviewers, study section chairs, NIH staff, institutional officials.
NIH is taking this issue very seriously. There do not appear to be widespread problems, but increased reporting and action is a cultural change.
What is the NIH Doing? Reporting & Action
We follow up on every allegation.
Cases are referred to the Office of Management Assessment (OMA) – independent of CSR - an investigative unit conducts fact-finding, investigations, and issues a report of findings.
Actions have included
- withdrawal of application
- removal of reviewers from peer review committees
- notification of the investigator/reviewer’s institution, which has led to personnel actions
- pursuing government-wide suspension and debarment
- referral to other agencies for criminal violations
Making Reporting Easier
Integrity matters. Say something! For concerns or questions about possible violations of peer review integrity, please contact your Scientific Review Officer, or the CSR Review Integrity Officer at csrrio@mail.nih.gov, or the NIH Review Policy Officer at peerreview@nih.gov. See the NIH Guide Notice on integrity in review.
Scientific Review Officers regularly discuss integrity and reporting avenues. This is done through pre-meeting training of all reviewers and in opening statements at review meetings.

